Measure twice, then cut everything else
Sangram Vajre on guiding metric discussions for RevOps and GTM teams
👋 Hey, Toni from Growblocks here! Welcome to another Revenue Letter! Every week, I share cases, personal stories and frameworks for GTM leaders and RevOps.
In case you’re new or haven’t subscribed yet, here are the latest best posts you may have missed:
It’s been another crazy week! we’re about to announce a couple more killer features in Growblocks around unlocking your metrics to help you visualize and make better data-driven decisions.
With that in mind, Sangram Vajre of GTM Partners has written a guest post this week on the same topic.
These days, it's common to hear how Go-to-Market teams are tasked with maintaining efficient growth by cutting spending, demonstrating their value, and achieving results.
A more skeptical perspective might summarize it as: “When the going gets tough, marketing spend is reduced. When marketing spend is reduced, the going gets even tougher.”
This directive poses a challenge because marketing and sales combine performance math, art, and instinct. While some aspects are straightforward to quantify and report on, others are much more difficult to justify from a return on investment perspective.
The primary challenge arises when we trim the less-measurable aspects of our marketing and sales programs; their importance can only be demonstrated retrospectively when we observe declines in pipeline or fail to meet revenue expectations.
This situation results in team underperformance, prompting additional questions, budget cuts, and sometimes, job insecurity.
GTM Attribution: The White Whale
We have long recognized the challenge of valuing hard-to-measure marketing activities, driving frustration and innovation.
From proving newspaper readership with front page returns to conducting traffic studies on billboard visibility for advertisers, and precisely measuring clicks on calls to action (CTAs), we have consistently sought to connect marketing efforts with performance.
This situation has led to a scenario where many marketing and sales technologies tailor themselves to measure specific metrics—often those they excel at capturing—portraying a favorable impact on company revenue.
As a result, there is now a proliferation of data points attempting to prove attribution in biased environments, causing internal confusion about metric relevance, trustworthiness, and the reliability of data sources.
GTM strategy (not your tech) should dictate what you measure
In times of confusion, the best remedy is to start fresh:
Identify your target market
Communicate your value proposition
Determine the channels and stakeholders driving your message
Specify where messages appear
Pinpoint key conversion moments
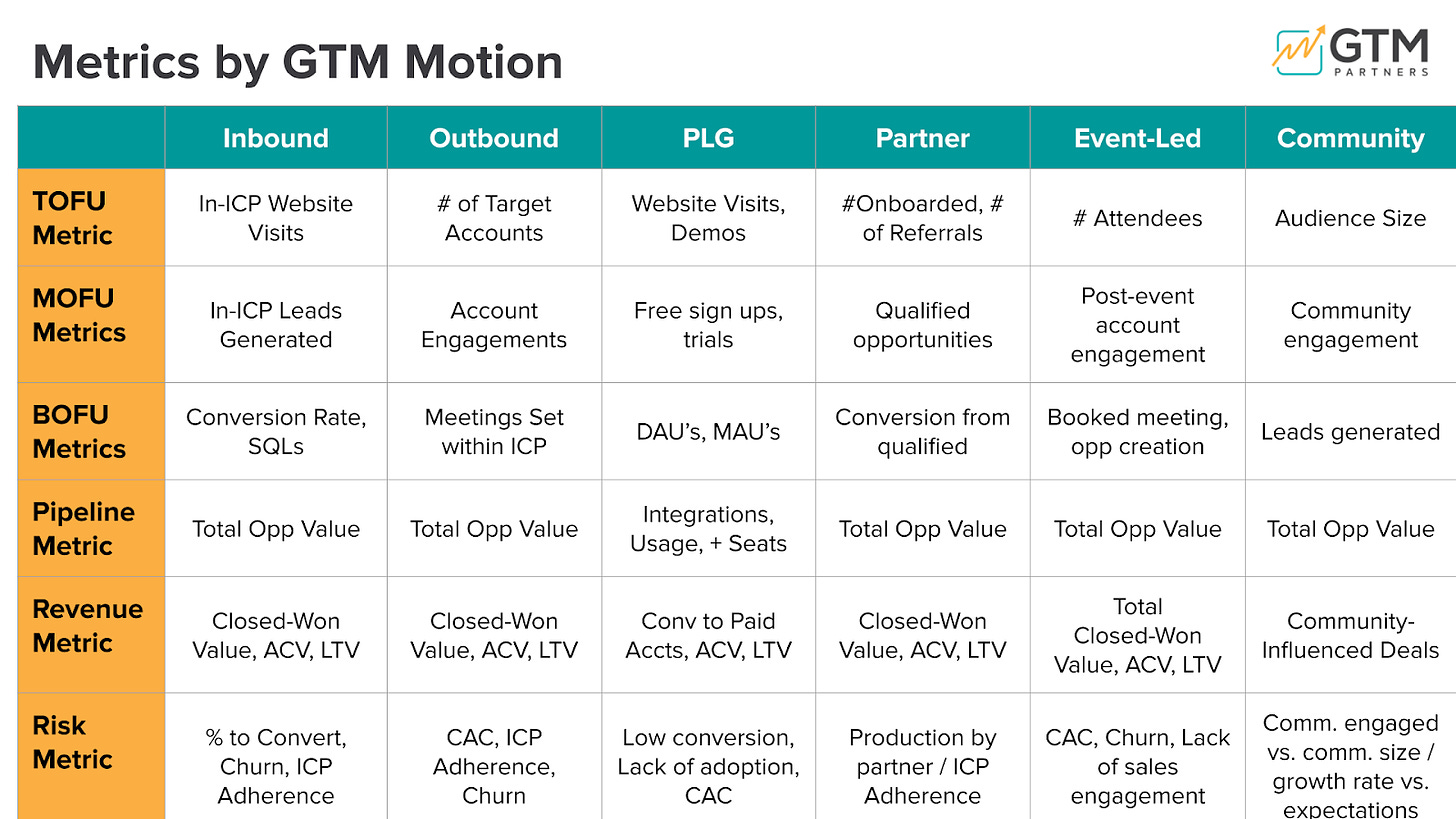
After addressing these foundational questions, select 5 to 6 segment-customized metrics to track strategy effectiveness across the entire Go-to-Market team:
Three Journey Metrics (Top of funnel, middle of funnel, bottom of funnel)
One or two performance metrics (Pipeline and revenue)
One risk metric (Lead metric indicating potential issues)
It is crucial that the metrics chosen to demonstrate Go-to-Market effectiveness align with core actions in the strategy. For instance, an Inbound-led approach may focus on metrics like website traffic, database size, email conversions, demo requests, and chats to gauge marketing and sales performance. However, in affiliate marketing, only a subset of these metrics may effectively represent performance.
For a comprehensive list of metrics tailored to each strategy, please refer to the accompanying chart.
Deciding & agreeing on what to measure
Revenue Operations leaders should lead the discussion on which metrics matter in an organization. However, this discussion should involve the entire Go-to-Market team collaboratively.
During the decision phase, examine various strategies and ensure metric coverage across the buyer journey. If there are measurement gaps, acknowledge them and resolve them, involving key leaders and experts in the relevant strategy.
In the agreement phase, there should be a robust dialogue between the key metrics owners and Revenue Operations to validate the chosen metrics. This will help understand the "why" behind the performance and monitor any metrics that are off track.
An apt analogy is to liken it to scientists who monitor seismic activity to forecast volcanic eruptions. Similarly, observing a blend of metrics within the strategic context can predict performance and reveal the culmination of activities that lead to success.
Communicate with relentless transparency & consistency
Once the metrics have been confirmed, the next challenge is to present the information to the organization effectively. Style, readability, context, and importance should all be considered when designing the dashboards.
Some additional tips include:
Organize funnel metrics in order
Always include goals and timeframes
Assign and state a metric owner (expert) who can explain the why behind the numbers
Keep the number of metrics to fewer than 40 pieces of information
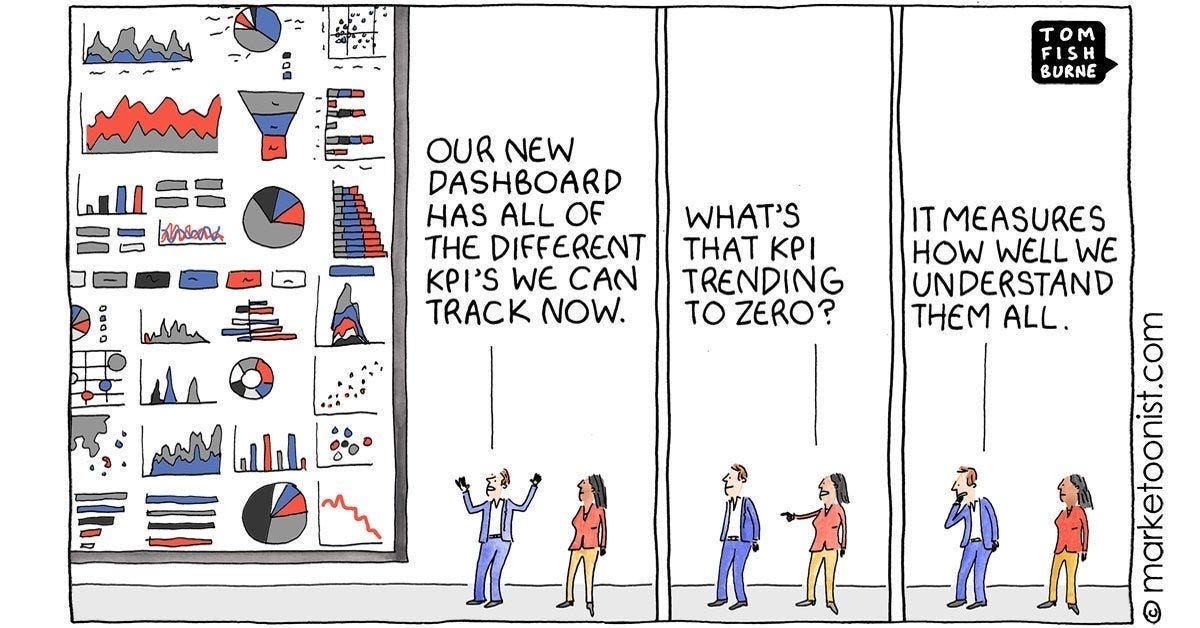
Avoid distracting with hyper visualization
It is important to remember that these dashboards are not meant to display "up and to the right" visuals that simply boost morale or meet board expectations. They are about providing essential business information and detailed insights to track our progress and identify any necessary adjustments in strategy or execution.
Finally, reviewing these metrics monthly with the entire Go-to-Market Executive team and quarterly with the entire Go-to-Market team will maintain focus on the process.
Bi-Weekly: The Revenue Operations Dashboard Leader meets with metrics experts to ensure understanding of underperforming metrics and activation of remediation plans.
Monthly: The Executive Go-to-Market Leadership Team reviews the dashboard, focusing on strategies to address underperforming metrics.
Quarterly: The entire Go-to-Market team conducts a review, emphasizing remediation efforts and connecting activities of individual contributors.
Key-takeaways
Focus on Strategy-Driven Measurement: The selection of metrics should align closely with the specific go-to-market strategy being employed. Understanding the target market, communication channels, conversion points, and risk factors are essential in choosing relevant metrics.
Collaborative Metric Definition: Revenue Operations leaders should lead discussions on metric selection, involving input from the entire go-to-market team. This collaborative approach ensures that chosen metrics cover the entire buyer journey and don’t shy away from any gaps in measurement.
Transparency and Accountability: Effective communication of metrics requires clear, consistent, and transparent reporting. Dashboards should prioritize readability, context, and relevance over superficial visual trends, focusing instead on providing actionable insights for strategy refinement.
Once again, a big thanks to Sangram from GTM Partners for the guest post this week!
Speaking of, they recently recently wrote an in-depth report about Growblocks.
You can read their whole report here.
Want to see the product in action? Book a demo with us here.


